Companhia Águas de Joinville (CAJ), State of Santa Catarina, Brazil

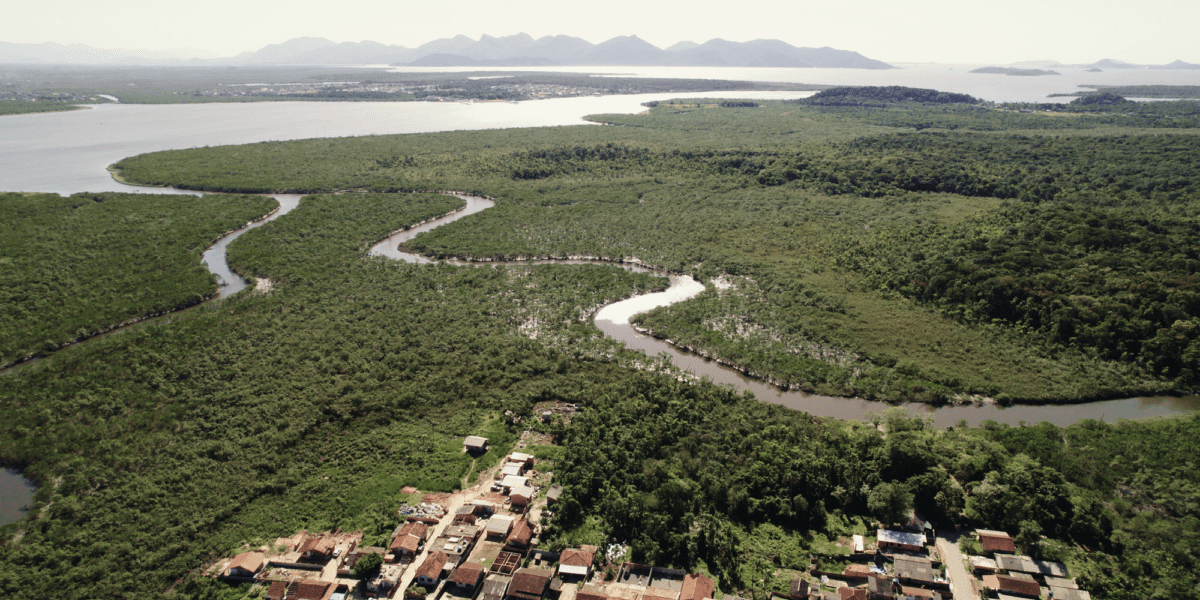
Aerial picture of Joinville, Brazil

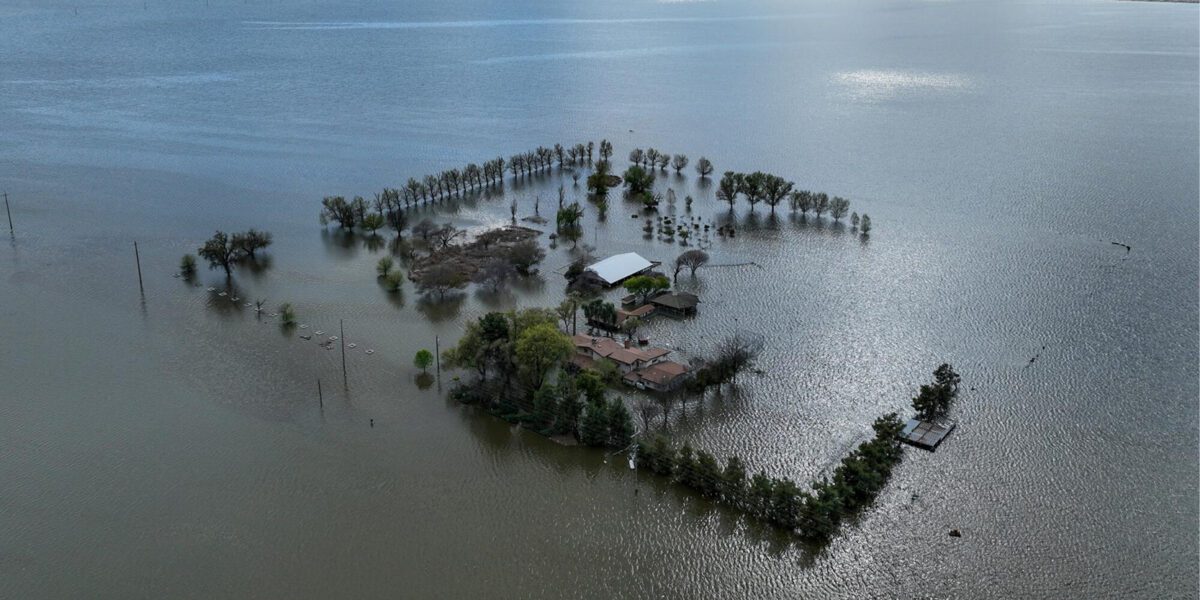
After a severe water crisis, the city of Joinville developed a contingency plan to maintain water supply during drought conditions. Preliminary simulations produced water shortages, so the city sought a more comprehensive network study and used Bentley applications to create a digital twin and perform a hydraulic analysis of the distribution system. The new contingency plan redistributed water across two sources – Cubatão and Piraí – guaranteeing water supply during severe drought and improving overall water distribution to the city. The proposed solution required less capital investment for implementation because it could optimize flow between city sectors utilizing the existing network and remove the need for costly additional piping and pumping (saving BRL 4.5M). The solution reduced production by 30%, equivalent to 170 liters per second in the fragile Piraí water source. This mitigated the effects of drought, benefiting 150,000 area residents. It also resolved issues within the Cubatão system, reducing water loss in critical district metered areas by 40,000 cubic meters per month and water shortage complaints by 90%.

California Water and Flood Management, California, USA

The New Bullards Bar Dam provides flood control, 340 MW of clean energy, and a reliable water supply for residents and the ecosystem. Over 50 years after its construction, extreme weather events have become more frequent and intense, increasing the risk to its structural integrity. The agency combined drone surveys and automated sensors with Bentley applications to improve inspections and obtain the level of detail that dam operator Yuba Water Agency needed. Combining IoT, 3D reality modeling, and artificial intelligence enabled survey teams to monitor the dam remotely, automatically detect tiny but growing cracks, and establish real-time, automated monitoring of the dam’s structural integrity. The new automated system provides 1,000 times more data monitoring points than the previous method, improving data accuracy by 50% and risk assessment by 100%. As a result, Yuba Water can immediately assess the dam during extreme weather events and after earthquakes to prevent disasters. Yuba Water now has renewed confidence that New Bullards Bar Dam will remain safer and more resilient in the face of climate change.

Extreme drought conditions have created water scarcity in the US West. In the Southern California Water Replenishment District (WRD) LA County, California, Bentley developed 3D models of the local water basins, creating a better understanding of groundwater flow and identifying contamination. These models helped WRD make the region more sustainable and drought resilient using local resources, including advanced treated recycled water to replenish groundwater supplies.

Coastal Resilience

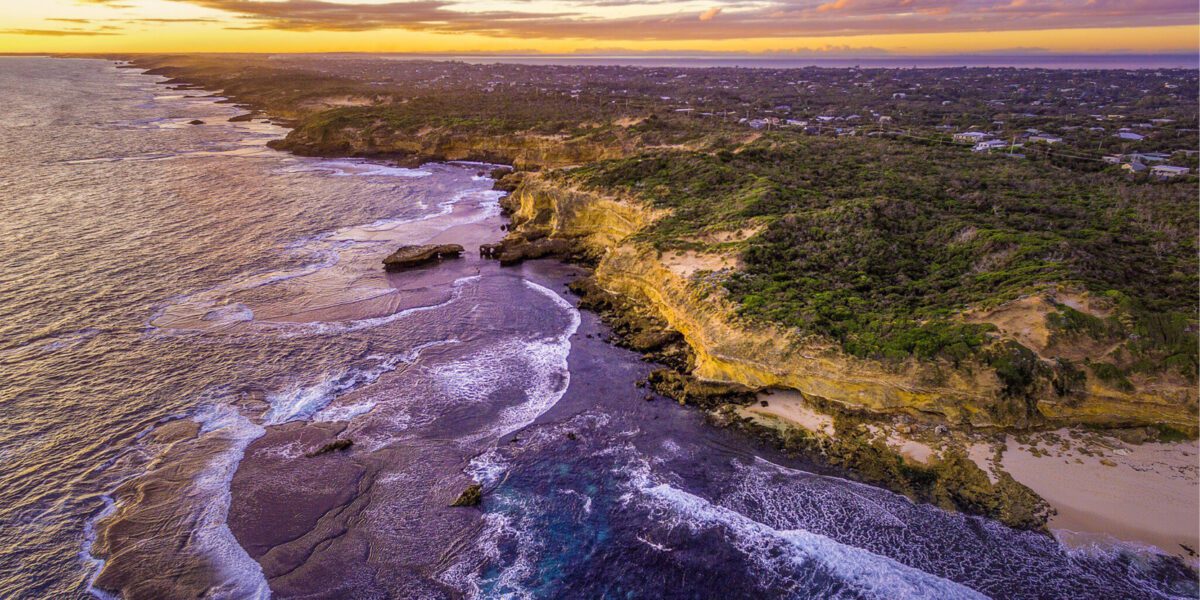
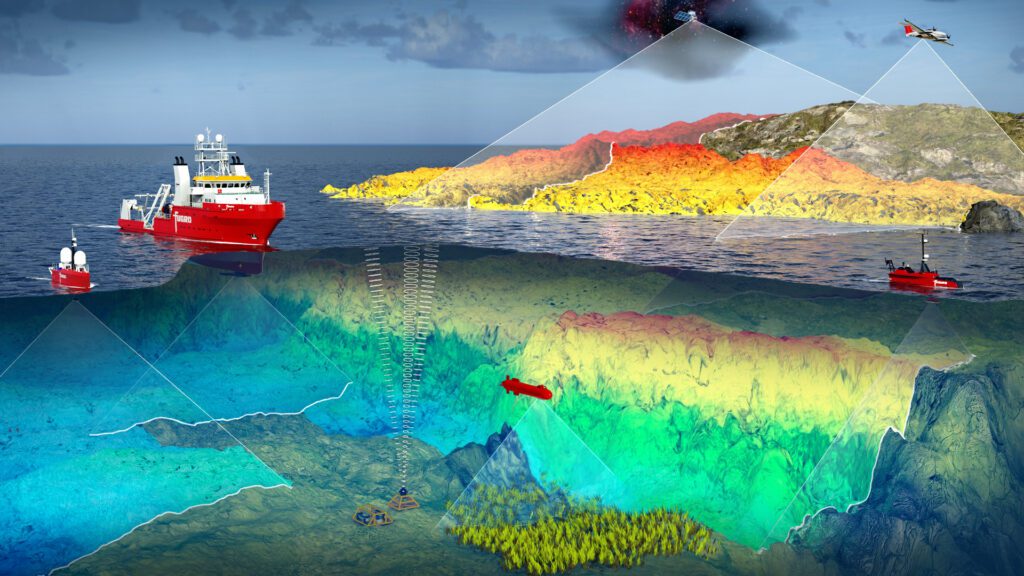
Geospatial data can help low-lying coastal populations make better climate change mitigation and adaptation decisions. Fugro’s coastal resilience tools and solutions provide geospatial insights that help assess the risk and prepare adaptation strategies, including nature-based solutions. Rising sea levels are causing more frequent and severe coastal flooding. Earth observation data, including satellite imagery, airborne data and ocean floor monitoring, are crucial to understanding climate risks. Governments are developing coastal resilience strategies with global and local spatial digital twins to aid planning, monitoring, and action. Vulnerable communities in small island states benefit from remote sensing-based digital twins, helping understand hydrological processes and coastal risks. Predictive analysis and recurring geodata programs inform infrastructure design and development planning for climate resilience. User-friendly access to spatial digital twins, aided by AI analytics and efficient GIS tools, facilitates better data-driven decision-making.

A specific example of Fugro’s LiDAR-based spatial digital twin that has helped coastal and SIDS (Small Island Developing States) stakeholders is the Tuvalu Coastal Adaptation Project, developed by the UNDP with financing from the Green Climate Fund. The resultant models provide an enhanced understanding of the islands’ hydrological processes and complex coastal risks. Tuvalu can now elucidate the relationship between land elevation and sea level, model future scenarios, and inform the design of coastal infrastructure and development planning.

Virtual World Asset Management

The generation, delivery, and storage of electricity presents unique challenges. The dawn of the renewable energy generation has seen traditional network operators and their aging assets come under significant strain. Outdated inspection programs are used to maintain the electrical power grid. These inspection processes include inspectors going into the field to gather information on the network and the surrounding environment. This is hugely inefficient, costly and environmentally damaging. Fugro has developed a remote sensing solution, Fugro ROAMES® creates a 3D digital twin of electrical grid networks, assets and the surrounding environment. This solution relies on AI and ML to process and deliver in-depth analytics rapidly across the entire network and is hosted through an online 3D visual assessment tool with embedded analytics. Fugro ROAMES® allows the utility sector to digitally inspect their assets from the office, saving up to 40% on inspection operating expenses, with a much-reduced carbon footprint.

Fugro ROAMES® transforms the inspection and maintenance processes for electrical grid networks and holds significant implications for city climate action. The  vegetation analytics help fortify the resilience of electrical networks against escalating natural hazards, a growing concern in the face of climate change. Traditional inspection methods often struggle to assess the impact of vegetation on power infrastructure, particularly in regions prone to wildfires and floods. Fugro ROAMES® 3D digital twin accurately captures the spatial distribution, species and health of surrounding vegetation. This enhances the overall reliability of electrical grids and serves as a crucial tool for cities grappling with the escalating risks of climate-induced disasters. By enabling utilities to proactively identify and mitigate potential hazards from vegetation, such as fire-prone areas or flood-vulnerable zones, Fugro Fugro ROAMES® contributes directly to the resilience of electrical networks. Integrating such technology aligns seamlessly with city climate action plans, as it empowers municipalities to adapt and fortify critical infrastructure in the face of a changing climate, fostering a more sustainable and resilient urban energy landscape.

Lifecycle Management and Modeling for Energy Solutions

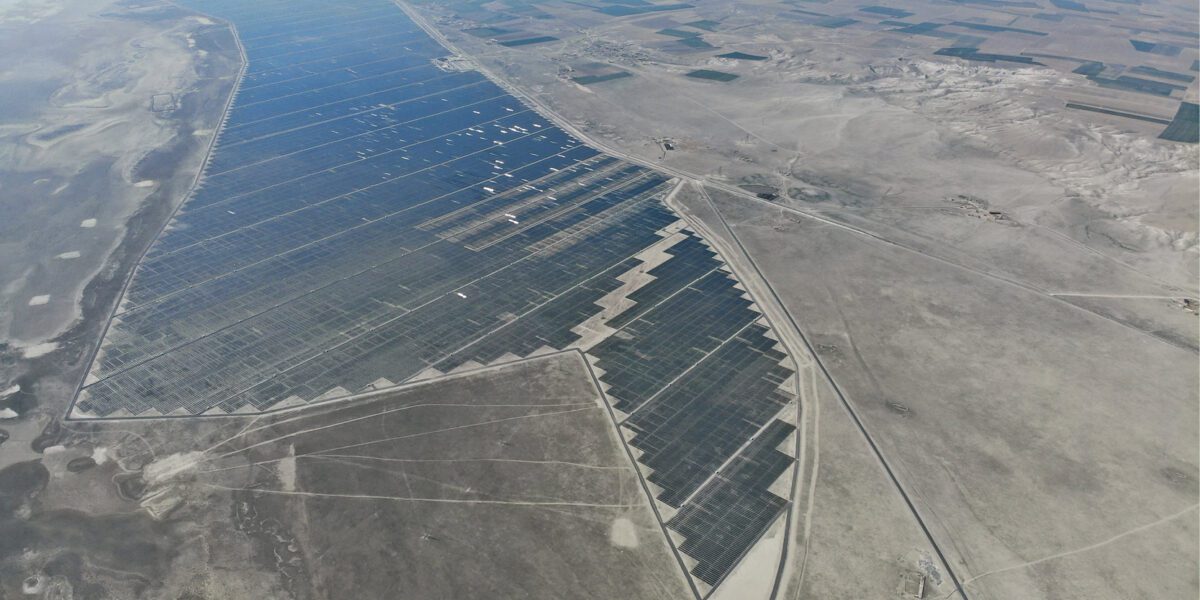
Bentley Systems provides digital twins from geospatial data to support the construction and lifecycle project management for many low-carbon energy transition projects. Optimizing construction design and program management on complex projects increases energy efficiency and reduces carbon emissions. the Konya Karapinar solar plant in Turkey, Bentley collected data from drones to generate 3D as-built point cloud models to create a digital twin of the power plant. Combining drone, photogrammetry and 4D Building Information Modeling (BIM) technologies provided project stakeholders with better visualization of the construction progress and the current project state.

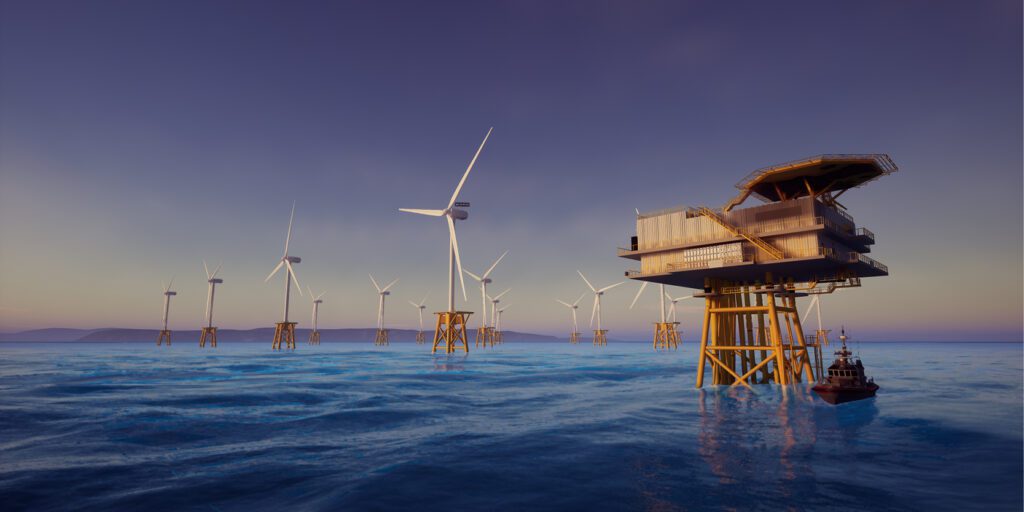
Offshore Windfarm Preview

China’s first anti-ice flow offshore wind project used Bentley’s integrated simulation and 3D design tools to achieve a digital twin model to optimize wind farm design, overcome uneven terrain, and protect wind towers from seasonal ice floes. Using Asset Reliability Management Software, owner-operators can use predictive analytics to anticipate failures and critical conditions. This approach can achieve up to 80% reduction in offshore inspection visits on the transmission assets, improve safety records and reduce carbon emissions.

In South Korea, Bentley worked with Doosan and Microsoft to develop a digital twin of one of its wind farms, creating a 3D model for operators. The digital twin links IoT sensor data, machine learning and models to accurately predict production output, maximize energy production, and minimize operations and maintenance costs. 

For geothermal energy projects, Bentley uses a subsurface digital twin to dynamically update their model while drilling to inform decisions around directional drilling and when to complete the wells. Managing and visualizing data to make important decisions saved tens of millions in reduced drilling costs and 85MW of energy.

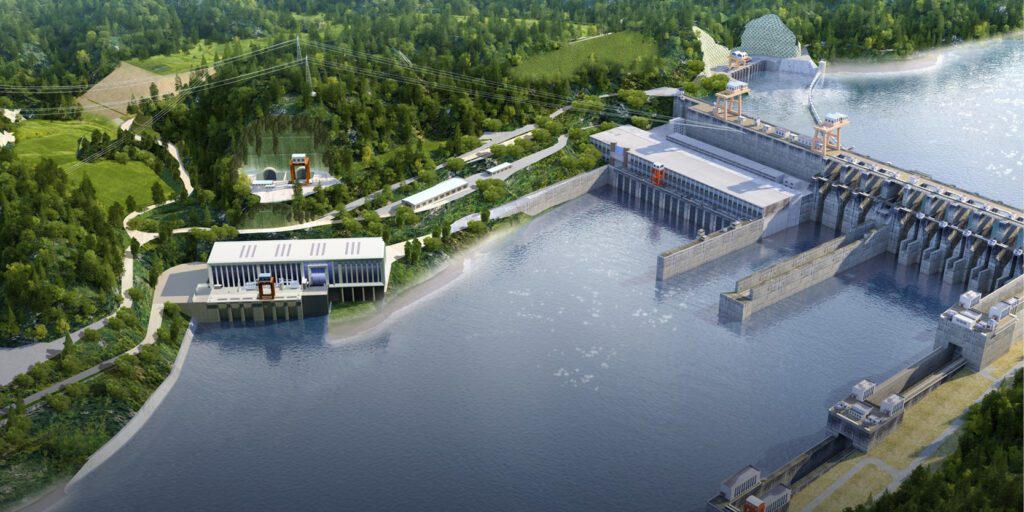
Visualization of Wuqiangxi hydroelectric power station in Joinville Brazil

The Wuqiangxi hydroelectric power station expansion project in Hunan, China, added 500 MW of capacity while reducing CO2 emissions by 472,100 tons. Bentley’s lifecycle digital plant management included solutions for design, 3D models and project collaboration to coordinate stakeholders and reduce the design time and construction cost. 

Similarly, Bentley supported the ITER Organization (an international nuclear fusion research and engineering megaproject of 35 countries) to build the world’s largest nuclear power plant. Once operational, it will be the first fusion device to produce carbon-free energy and maintain fusion for long periods for the commercial production of fusion-based electricity. 4D planning technology at ITER, combining construction schedules and detailed engineering CAD models, provides a detailed visual representation of activities and greatly improves the speed and quality of the construction schedule.

Geospatial Analysis Platform for Climate Resilient Cities

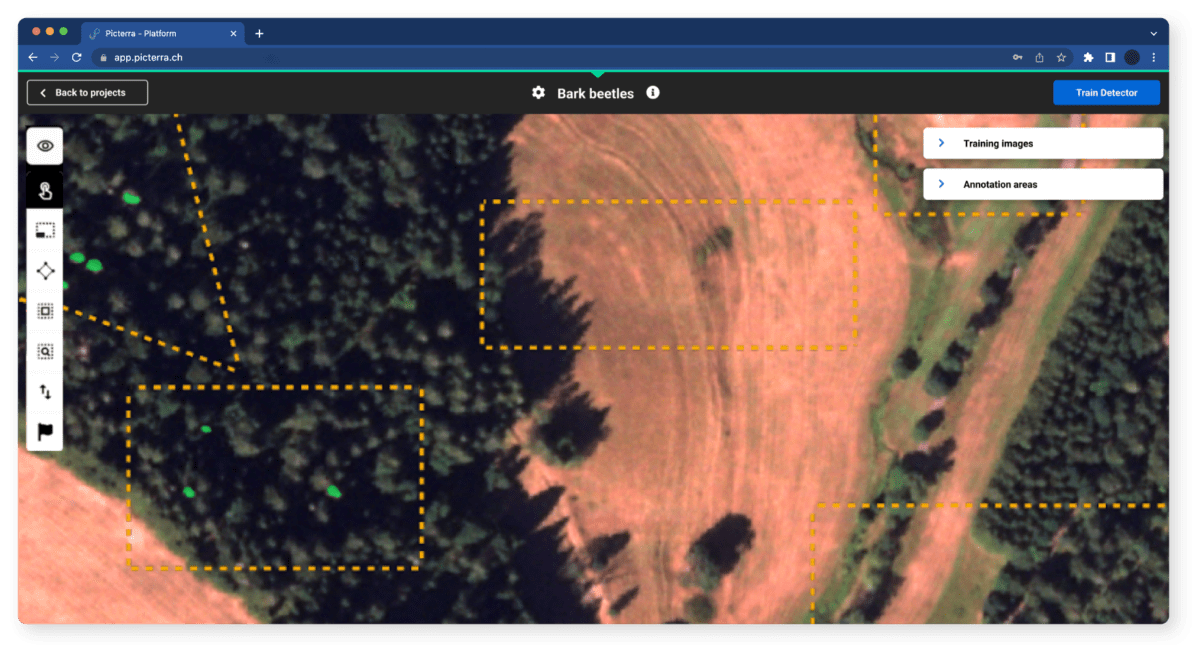
Machine learning models custom-created in the Picterra platform enable fast and accurate land classification, object detection, mapping processes and analysis of high-resolution global urban-area maps, allowing cities to track future urban land-use changes and identify adaptation needs. Geospatial analysis allows cities to monitor environmental parameters such as vegetation health, land cover changes, biodiversity or water resources.

Users can assess the impact of climate change on ecosystems or air quality, track biodiversity preservation efforts in and around the city, and tackle urban heat islands or water pollution. Through the analysis of geospatial data and historical patterns, cities can identify high-risk areas and develop strategies for mitigation and adaptation of hazards like floods, as well as identify suitable locations for renewable energy installations and optimize energy efficiency, supporting the scaling up of renewables in heating, cooling, transportation, and power sectors. 

Pune Metropolitan Region GIS Portal, Pune, India

PUNE Geoportal


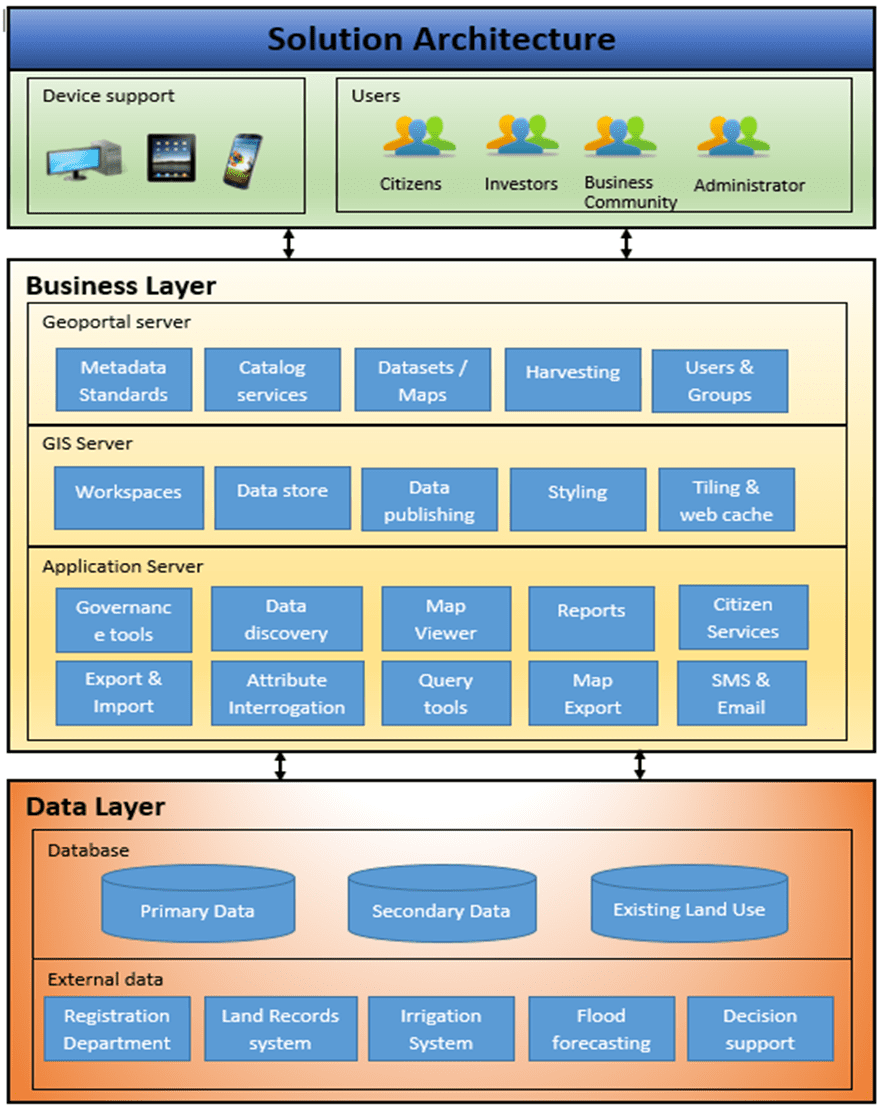
The GIS Portal for Pune Metropolitan Region Development Authority (PMRDA) project created by IIC Technologies includes multiple components: a desktop study, establishing ground control network, capturing digital aerial photography, creating a geo-referenced land records system, developing a base map, preparing an existing land use map, building a geo-portal, and providing training and maintenance.

PUNE Geospatial Solutions Architecture

The project aims to improve metropolitan governance by utilizing geospatial technologies for data collection, analysis, and dissemination. These lay the foundation for an accurate geospatial data repository critical for understanding the current state of land use, natural resources, and environmental conditions. This facilitates informed decision-making on urban planning, land cover change monitoring, disaster management in case of floods and droughts, environmental protection, and climate resilience strategies.

Environmental Information Management System, Pacific Nation, Niue

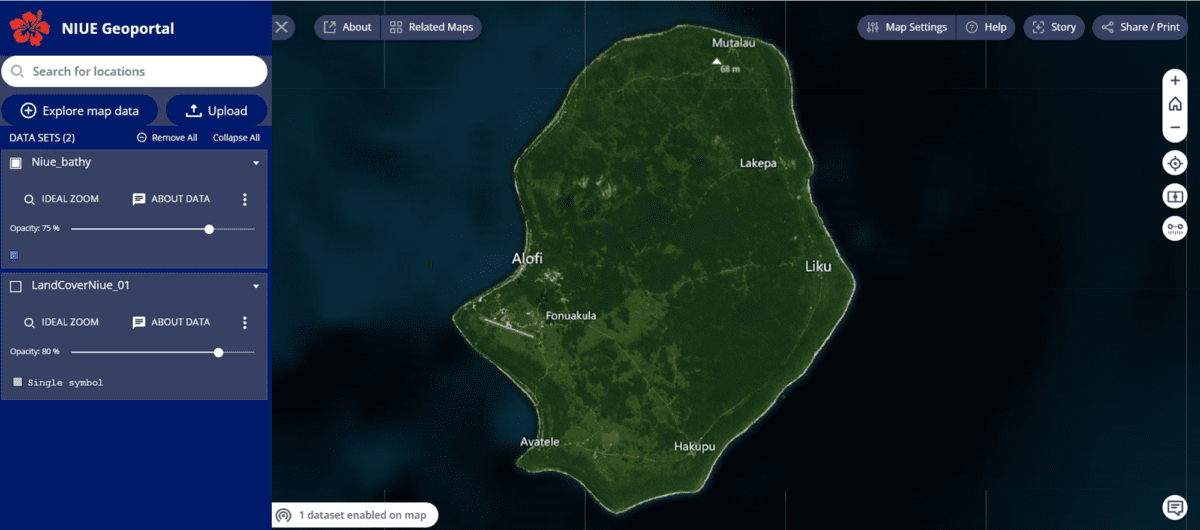
NIUE Geoportal’s desktop view

Niue’s Statement on Climate Change states, “Niue remains one of the most vulnerable nations to the adverse effects of climate change and, as such, faces the most dire and immediate consequences… Niue is subject to extreme climate events such as cyclones and droughts.”  As part of its strategy, the Statement addresses the need “to improve and strengthen the collection, storage, management and application of climate data…, to monitor climate change patterns and its effects.”

IIC Technologies responded to this challenge by creating the Niue Environmental Information Management System (EIMS), a comprehensive solution to effectively utilize the nation’s geospatial data. The EIMS data infrastructure, developed as a cloud-based platform using open-source technologies, aims to overcome critical issues such as the lack of a national data repository and limited data management capabilities. This innovative system provided a unified suite of functionalities for effective loading, management, and visualization of geospatial and non-geospatial data. Stakeholder engagement played a crucial role, with extensive meetings to understand user requirements. Additionally, the project had positive side benefits, including increased data holdings, community engagement, educational development, and preservation of cultural heritage.

US Climate Mapping Portal, USA

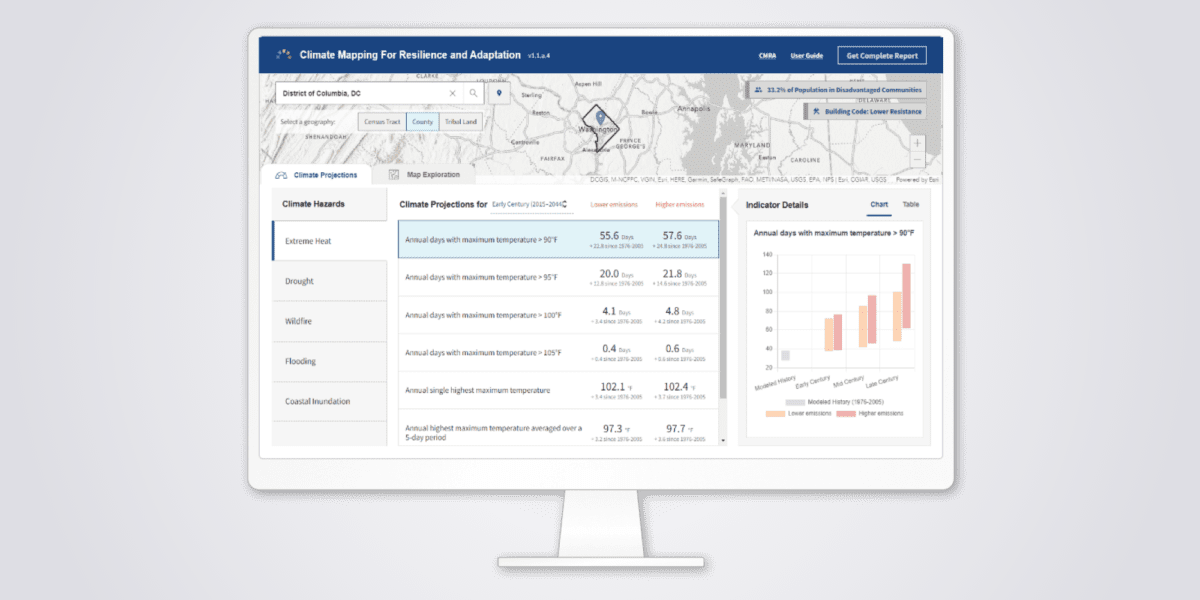
Climate Mapping for Resilience and Adaptation (CMRA) Assessment Tool’s Desktop View

With so much data and information freely and readily available, a web-based tool implemented by the U.S. Government helps make sense of it all using engaging visuals and current maps and statistics. Esri software created an interactive tool, the Climate Mapping for Resilience and Adaptation (CMRA). CMRA was developed in 2022 as part of a U.S. government interagency partnership, under the auspices of the U.S. Global Change Research Program, to make authoritative climate data easily accessible and understandable to state, local and tribal communities to inform their climate actions and investments. The site was developed by Esri, and the National Oceanic and Atmospheric Agency (NOAA) hosts and manages CMRA.

The portal supports communities’ understanding of which climate-related hazards they face the most risk from today and in the future with real-time dashboards and future climate predictions for heat, drought, wildfire, flooding and coastal inundation threats. Users can view current maps showing where climate-related hazards are occurring today, their impacts on people and the economy, and how they are projected to change over time based on different climate scenarios. The information can be explored through interactive maps and charts to inform climate strategies or generate a report summarizing the information for a selected geography. These reports are helpful as supporting evidence in project justifications and grant applications. All geospatial data in the tool is also available for reuse through open web services. In addition, users can find federal policies relevant to climate adaptation and federal funding opportunities that can help pay for climate resilience projects in the U.S.