Pedestrian and Urban Mobility Studies, Madrid, Spain

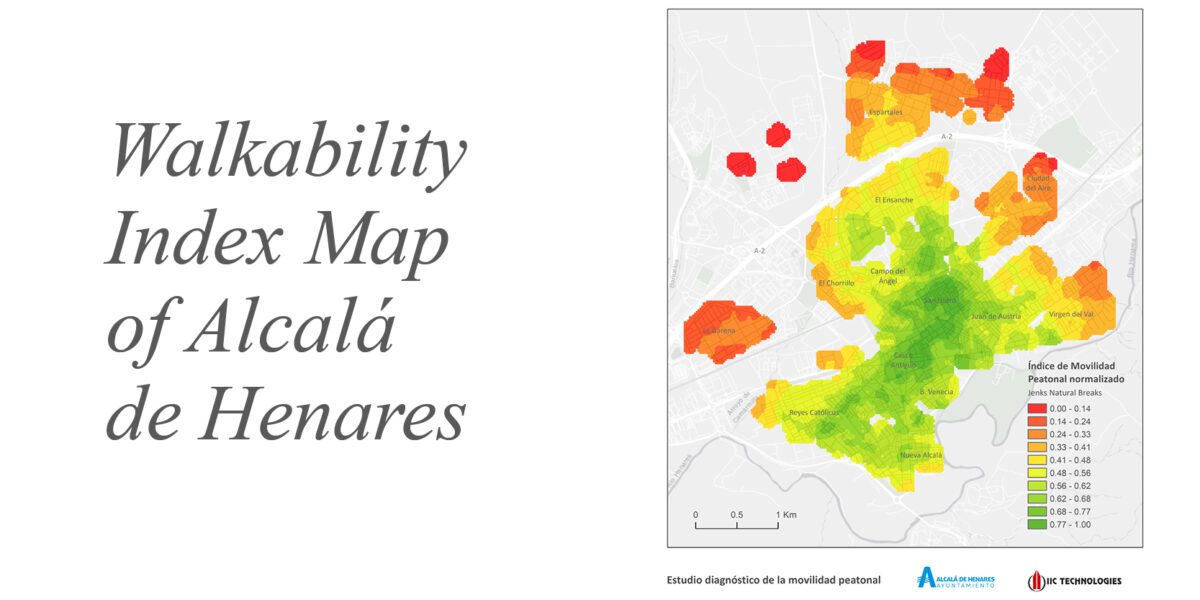
Walkability Index Map of Alcalá de Henares


In the historic city of Alcalá de Henares (Madrid, Spain), a transformative project is underway to redefine urban mobility. The city’s Council launched an ambitious integrated sustainable urban mobility plan. Central to this effort is a pioneering diagnostic study of pedestrian mobility and walkability by IIC Technologies, utilizing cutting-edge GIS tools and open-source geospatial data. This initiative aims to promote sustainable transportation, enhance connectivity and territorial equity, and reduce car dependency. The GIS data analysis delves into critical factors such as proximity between residences and workplaces, essential amenities, public transport links, green spaces, land-use diversity, and connectivity. The outcome is a series of innovative maps and an Esri geodatabase, offering local authorities a powerful tool for guiding public investment and developing strategies to address the city’s mobility challenges. This project facilitates smarter decision-making and engages the community through visually appealing and informative maps, marking a significant step forward in urban planning.
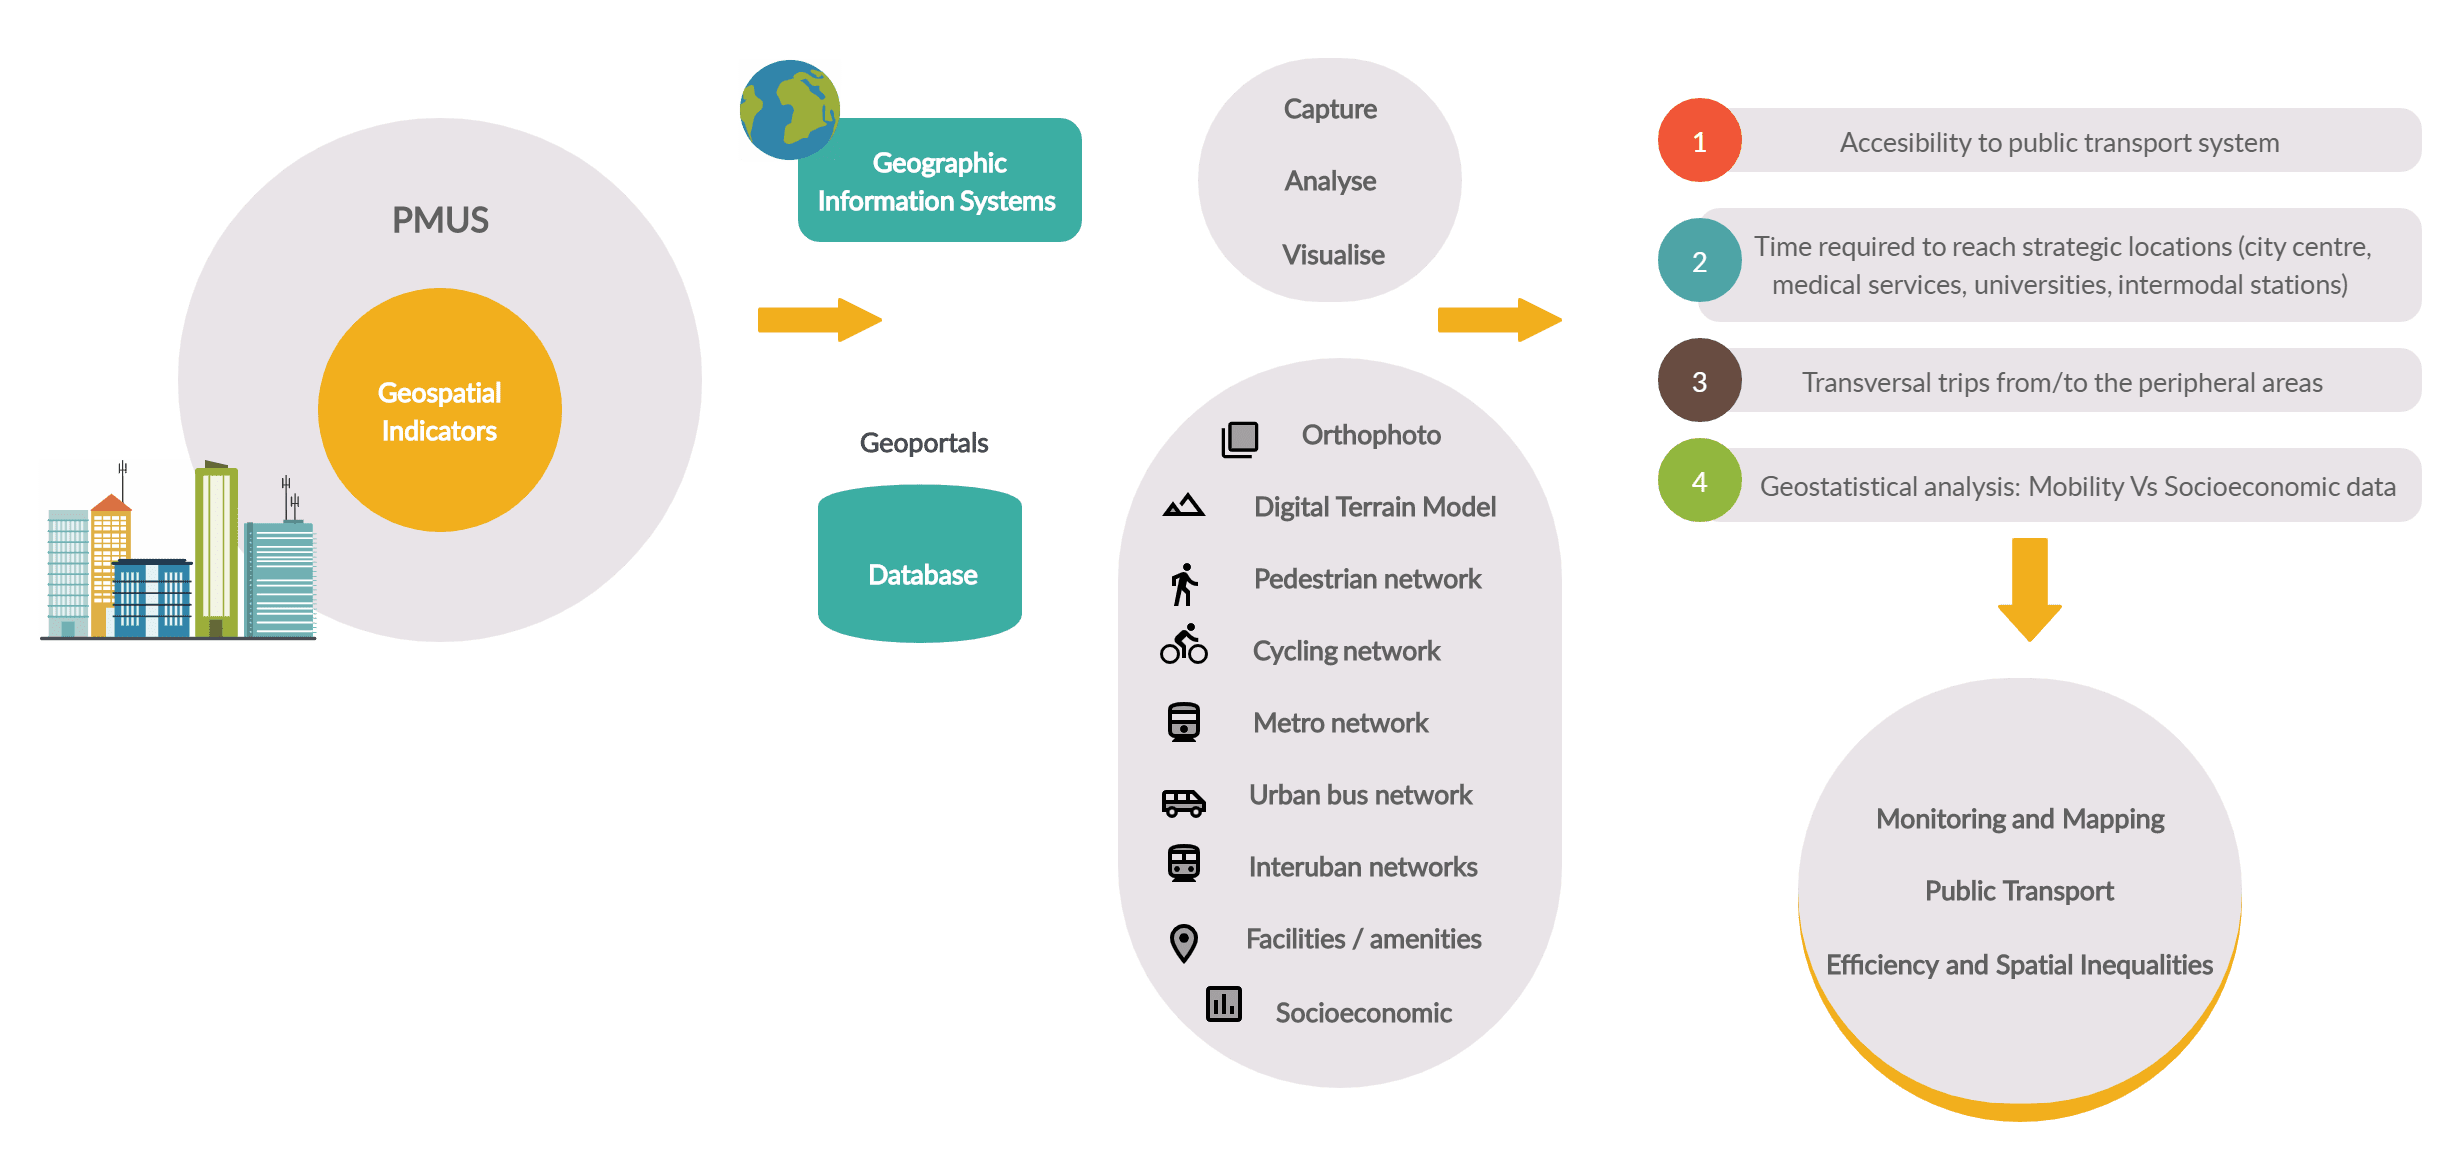
Diagram showcasing GIS-based performance indicators for assessing Madrid's public transport network

In another study, IIC Technologies is performing research to develop GIS-based performance indicators for assessing Madrid’s public transport network. Despite sustainable mobility initiatives, pollution levels remain high, and the network lacks competitiveness for transversal trips. GIS will be used to analyze connectivity, optimal routes, and transport supply and demand scenarios. Utilizing open geospatial data, the research project will provide geospatial tools to monitor the sustainable urban mobility plan and guide initiatives for sustainable transport. The project aims to measure accessibility, evaluate transversal trips, and quantify time and distance to optimize transportation options. The study expects the outcomes will enhance monitoring, evaluation, modeling, and public participation in mobility policies, promoting sustainable and equitable urban transport.

Traffic Index, Global Coverage

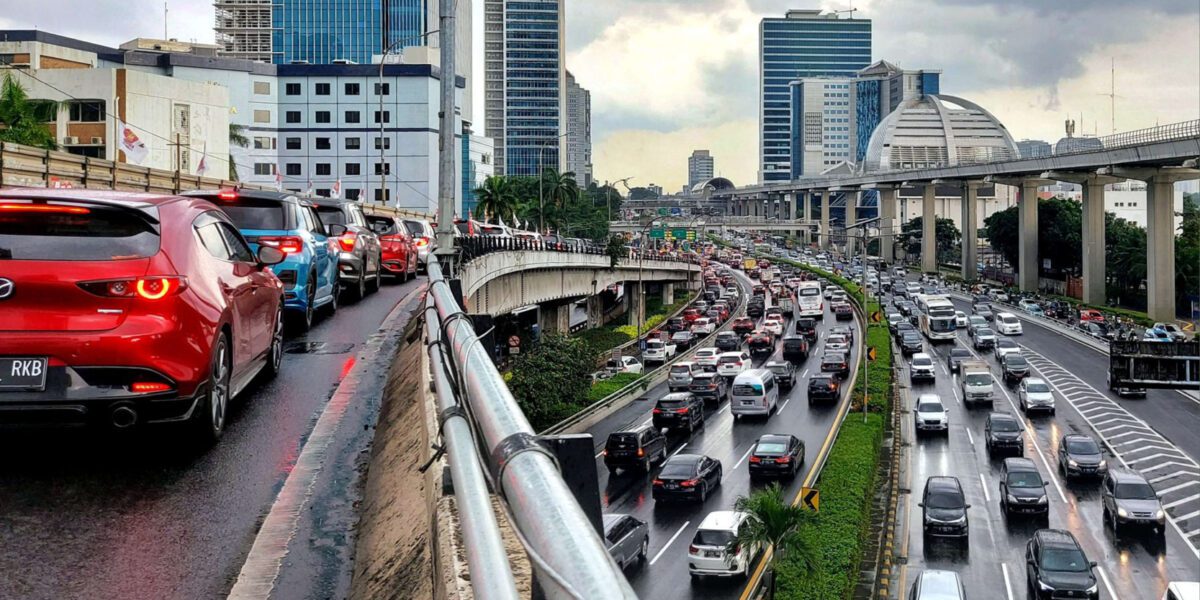
The TomTom Traffic Index covers 390 cities across 56 countries on six continents. It measures cities worldwide by travel time, fuel costs and CO2 emissions, providing free access to city-by-city information. Drivers, city planners and policymakers can use the index to help tackle traffic-related challenges. Using real-time traffic information and accumulating trillions of data points each year, TomTom can help cities predict traffic hot spots and peak hours, analyze what happened over time and create profiles of roads and congestion. These profiles consider CO2 emissions, fuel prices and time spent driving and compare car driving with other means of commuting. Their real-time traffic, origin-destination analysis, traffic statistics, and junction analytics have basic information available to the public at no cost, with subscription options for more advanced information. As part of its efforts to support sustainable development goals, TomTom partnered with the global nonprofit International Road Assessment Program (IRAP) to compile international road safety standards, giving roads one-to-5-star ratings and identifying the world’s most dangerous roads.  

Carbon Mapper

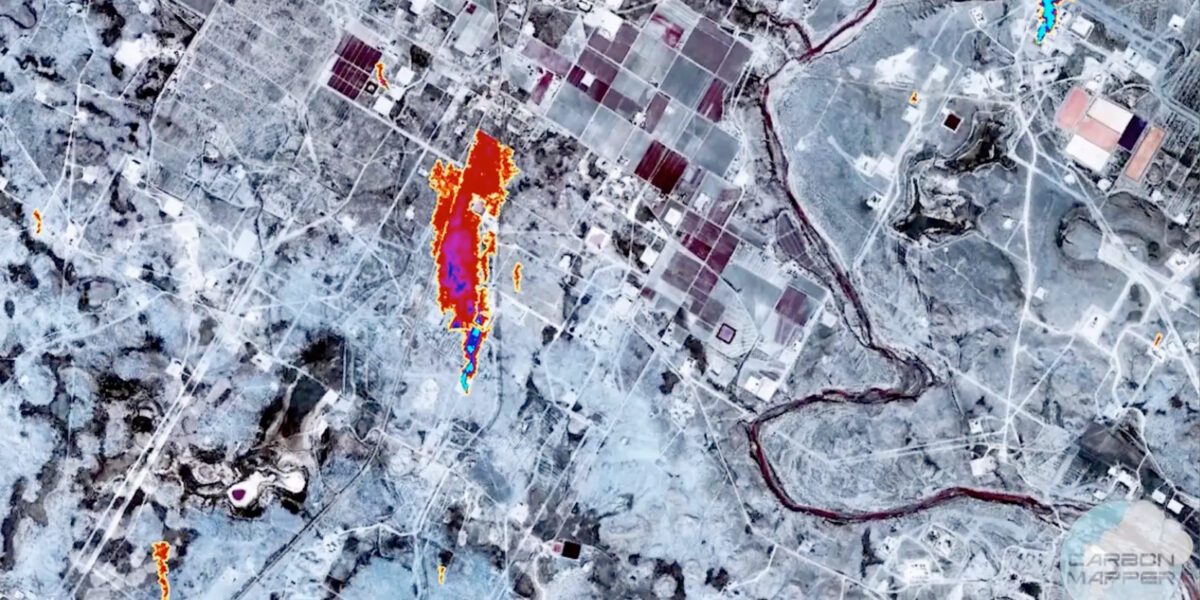
In 2021, Planet entered into a partnership with Carbon Mapper, a new nonprofit organization, and its partners – the State of California, NASA’s Jet Propulsion Laboratory (NASA JPL), the University of Arizona, Arizona State University (ASU), High Tide Foundation and RMI to build a hyperspectral satellite constellation with the ability to pinpoint, quantify and track point-source methane and CO2 emissions. Planet’s hyperspectral satellite mission allows for increased transparency and accountability by providing rapid methane leak detection, while its partner, Carbon Mapper, is developing a global portal for broader adoption and providing a trusted certification chain underpinned by its public-private partnership. This technology can provide governments with the tools to measure point-source methane emissions and enable remediation and prevention.

Once launched, Planet’s methane-specific hyperspectral offering, named Tanager, is intended to help users identify and quickly address methane plumes emanating from specific facilities. According to the US EPA, the major sources of methane emissions in urban areas come from landfills, agricultural sites, waste combustion, and fugitive emissions from oil and natural gas systems or wastewater treatment. Tanager’s capabilities can be tasked to assist in infrastructure surveys, producing greenhouse gas measurements for climate planning, and as a monitoring capability for areas of concern. Planet’s satellite-based technology aims to balance coverage and sensitivity, covering enough area with a frequency to meet user needs while providing the sensitivity needed to find facility-level leaks.

Methane Emissions from Pipelines and Landfills

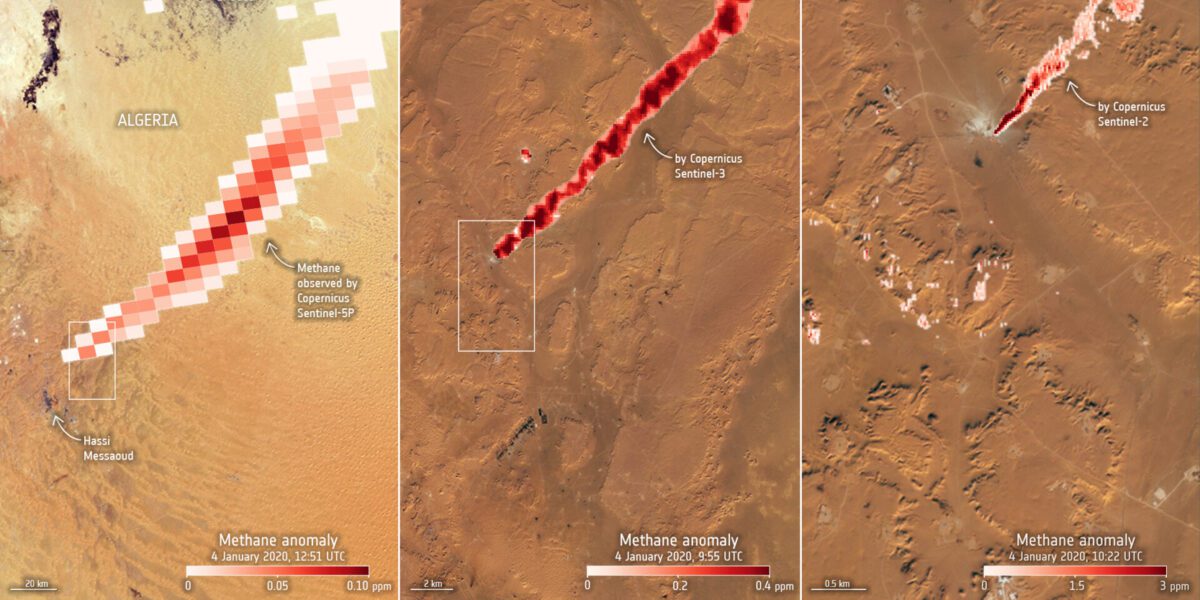
While methane is emitted from various natural and man-made sources, methane super-emitters release a disproportionately large amount of methane compared to other emitters. Super-emitters include industrial facilities such as oil and gas operations, coal mines and landfills with equipment or infrastructure issues leading to significant methane leaks. GHGSat is focused on identifying greenhouse gas super-emitters and ascertaining the precise location of the leak to quickly, effectively and (usually) inexpensively resolve it. Their nine-satellite constellation works alongside the European Space Agency’s Copernicus Sentinel-5P satellite, which can produce a global map of methane emissions daily at a lower resolution. GHGSat’s higher resolution imagery can give more precise information to pinpoint the exact location of the emission source. The expanding fleet of satellites can provide data that would have been impractical and expensive to collect just a few years ago and help countries audit their climate impacts and more accurately monitor the progress of their Nationally Determined Contributions under the Paris Agreement.

In March 2023, researchers at the University of Leeds in the UK discovered methane leaking from a faulty pipe in Cheltenham, Gloucestershire, using satellite data from GHGSat. This marked the first time a UK methane emission has been seen from space and mitigated. The precise location was discovered with the 25m high-resolution satellite imagery, which can detect emissions from individual facilities, making small leaks visible and accurately measurable from space. Using data collected over two months, scientists discovered the site was leaking methane at a rate of ~200 – 1,400 kg/hr. Once the researchers and GHGSat alerted the pipeline owners, remedial action was taken through repairs, and the problem was fully resolved by June, with no further emissions detected. 

In 2021, GHGSat and ESA Copernicus satellites detected substantial quantities of methane leaking from landfill sites close to the center of Madrid, Spain. Scientists from the SRON Netherlands Institute for Space Research and GHGSat discovered both landfill sites combined emitted up to 8800kg of methane per hour in August 2021 – the highest observed in Europe by GHGSat. Additionally, in April 2021, a GHGSat satellite recorded large quantities of methane (approximately 4000 kg per hour) from the 73-hectare Matuail Landfill in south Dhaka, Bangladesh. Yet another landfill site near Jakarta, Indonesia, was measured to emit 15,900 kg per hour, equivalent to nearly 400,000 kg of carbon dioxide per hour. 

Mapping and Managing Gardens, Arizona, USA

Desert Botanical Garden is a 140-acre nonprofit botanical garden in Arizona known for its botanical research and conservation programs. Previously, the garden used outdated paper-based mapping workflows to manage its facilities and 50,000 desert specimens from around the world. Today, DBG staff are creating a more accurate representation of the garden using digital maps powered by GIS technology to help manage and conserve the garden. The staff uses centimeter-precision Global Navigation Satellite System (GNSS) receiver devices from Bad Elf and mobile Esri GIS apps to create a digital twin and geodatabase of the garden’s specimens. GNSS receivers empower GIS and survey professionals to collect high-accuracy field data using any phone, tablet, or laptop. By having accurate plant data up to one centimeter, DBG staff can easily locate plants, run reports on their health, assign tasks related to the plants, and add pins to note damages or layers for future tasks. This data-driven digital twin is essential for managing the health of the collection.

Geospatial Database for Nature Reserves, Egypt

The Egyptian Environmental Affairs Agency (EEAA) aims to preserve the country’s natural resources and biodiversity within a context of sustainable development. As part of the Ministry of Environment in Egypt, the agency is concerned with introducing and integrating environmental dimensions in policies and programs that protect human health and manage natural resources. Nature reserves are crucial in securing and maintaining ecosystem balance, protecting essential habitats, building resilience to climate change, providing global food security, maintaining water quality, and conserving natural resources.

Egypt’s nature reserves are essential to its culture and climate resiliency. However, climate change has increasingly impacted the ability of the environmental agency to manage and understand biodiversity. To meet its strategic objectives, the Egyptian Environmental Affairs Agency (EEAA) and Strategize It Egypt implemented geospatial technologies, allowing accurate analysis of areas to help the government make critical decisions about preserving these natural areas. The new management solution, using Esri software, supports the EEAA team in creating an environment of increased productivity by building, developing, collecting, updating, and managing the geographic data of Egypt’s nature reserves. As climate and biodiversity concerns are at the forefront of our lives, this geospatial database for Egypt’s Natural Reserves solution will encourage more governments, regionally and globally, to see the value of GIS in helping shape a more sustainable planet.

Urban Heat Island (UHI) Effect in Fresno, California

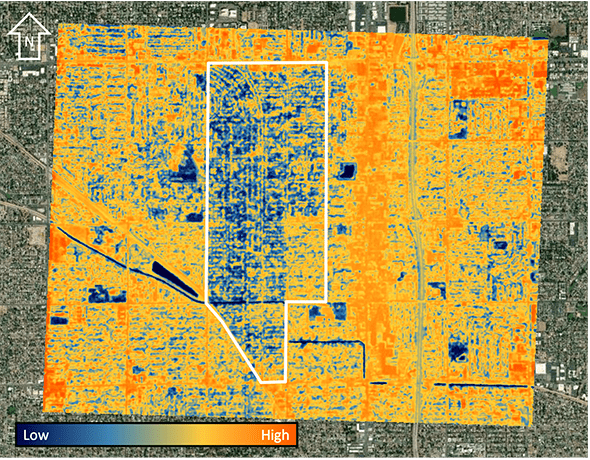
SatVu HotSat-1 imagery, Fresno, California – 31st July 2023 at 21:35 UTC (14:35 PDT). Local temperatures at the time of capture exceeded 38°C (100°F). The highlighted area represents the extent of the Fig Gardens residential area, showing a cooler temperature than the surroundings. Areas with limited vegetation, like the strip mall area to the East of Fig Gardens, show warmer temperatures than the surroundings.

On July 31st, 2023, SatVu’s satellite HOTSAT-1 captured thermal data within Fresno, California. The data showed a cool blue zone aligned with the neighbourhood of Fig Gardens. This area is known for its high density of mature trees, as seen in aerial data.

Fig Gardens, developed in 1910 north of Fresno on previously unused land covered with hardpan, was revealed to have sandy soil beneath. The developer planted fig, eucalyptus, cedar, oleander, and shade trees, then sold the land to new residents who built homes and created a community. In 1919, the remaining land was subdivided into residential lots to develop a suburban environment. Today, large mature trees are a defining feature of Fig Gardens and contribute to its community feel.

Fig Gardens is a desirable area to live in but has a high price tag. The median home price in Fig Gardens is $715,000 compared to $396,000 for the rest of Fresno. Additionally, there is a disparity between this area and the rest of Fresno due to past discriminatory policies.

The history of Fig Gardens and Fresno is fascinating. Thermal imagery from SatVu highlights the benefit of planned urban greening to reduce the Urban Heat Island (UHI) effect. UHI contributes to heat-related illnesses and deaths and impacts a city’s economy through increased strain on energy infrastructure and the liveability of its citizens. SatVu is developing data and insight products to enable city managers to understand, manage, and mitigate the heat risk in their community.

Trust for Public Land (TPL) and Urban Parks, USA

TPL developers designed ParkServe, an Esri-powered GIS tool and comprehensive database of local parks in nearly 14,000 US cities, towns, and communities. City leaders and park advocates can access TPL’s extensive database of local parks to guide improvement efforts and quantify and measure park inventory quality. ParkServe data underpins TPL’s engagement with cities. A few years after recovering from Hurricane Katrina, New Orleans became one of the first TPL Climate Smart Cities partnerships. Causing more than 1,800 deaths and $125 billion in damage, Katrina was a harbinger of the disruptive weather events that would increase with climate change. As the city prioritized improving climate resilience, TPL facilitated the creation of “green schoolyards,” replacing concrete surfaces prone to flooding with gardens of native plants that absorb rainfall and runoff. Several other interventions, including wetlands restoration and stormwater catchment basins, also addressed flood concerns while increasing open space access for neighborhoods that did not previously have it.

Mapping One Million Trees, Bentley Mendoza, Argentina

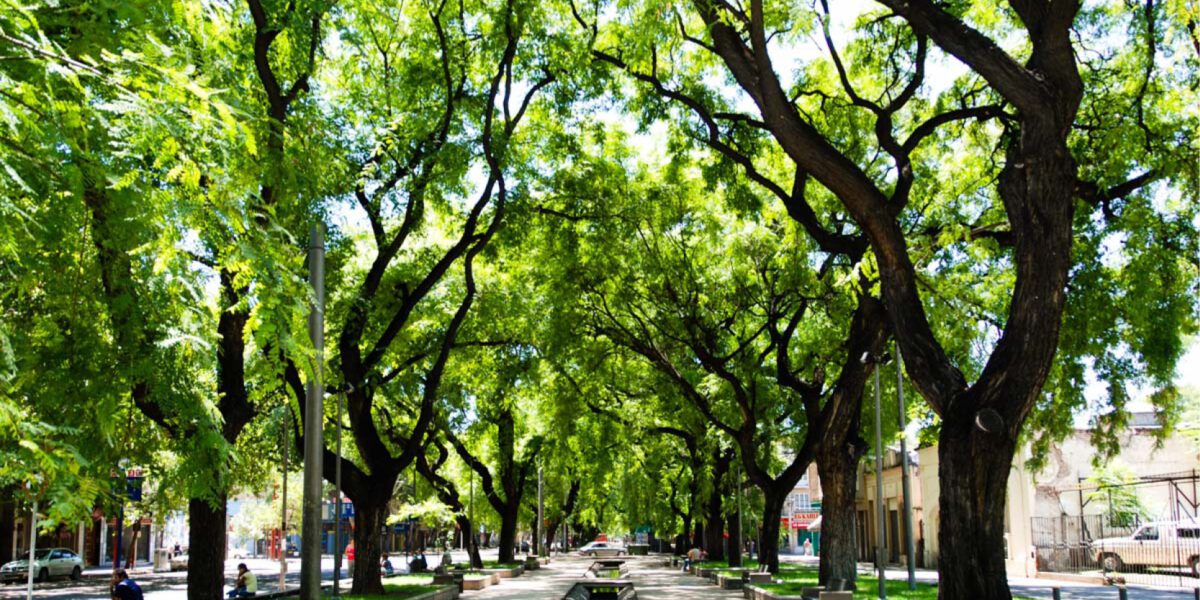
Trees make cities more resilient to floods, attenuate the effects of heat waves, regulate air quality, and create healthier and more livable environments. In Mendoza, Argentina, Bentley and GenMap built a city-scale reality model of the region’s green infrastructure using mobile mapping technology, identifying and mapping one million trees using object feature extraction. The project digitalized, geo-referenced, and obtained the dimensions of each tree and surrounding roads and sidewalks in the area to manage the green infrastructure remotely. The resulting database enables efficient management of the health condition of each tree.

Integrated Management of Urban Water Cycle, Porto, Portugal

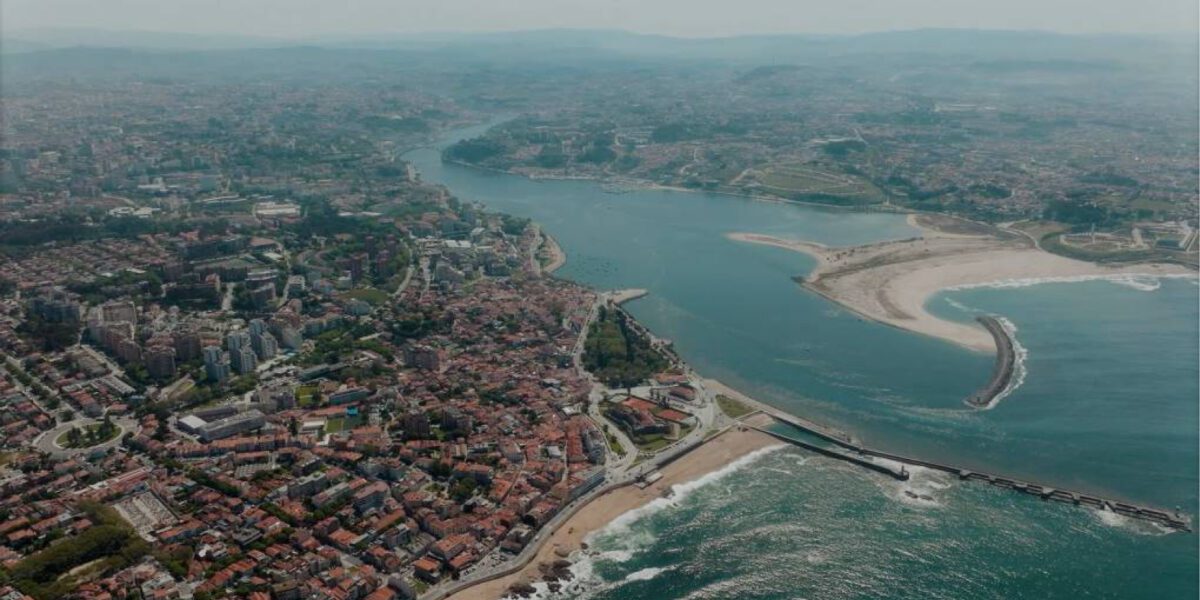
The municipal water and energy utility organization created an online platform combining all data sources (from GIS, real-time network sensors, household meters, SCADA, laboratory billing, work orders, and logistics). The city of Porto used Bentley’s technology to create a digital twin of the city’s water supply, wastewater, stormwater, and bathing water systems that helped forecast flooding and water quality issues, enabling the city to improve its response and resilience. Implementing all the modeling domains and the plug-in-based server capabilities contributed to the success of the implementation at the city scale. This eased the integration of new models, data sources, and tools and helped put these components into operation and publish results seamlessly. This utility can predict performance, identify failures early, and prescribe actions based on asset information. Forecasts, alerts, and what-if scenario modeling lowered water supply interruptions by 22.9%.